
Visual Debugging in IntelliJ 
A software developer spends a large amount of their time validating and debugging software. Traditionally, debuggers depict information in a text-based format. However, in my opinion, when there are many connected objects, a graphical representation during debugging is easier to comprehend. Thus, I implemented an open-source plugin for IntelliJ IDEA, which visualizes the program state as an object diagram during debugging. The following YouTube video demonstrates the use of the Visual Debugger.
I published two research papers about the Visual Debugger. The first paper describes the Visual Debugger and its motivation (preprint). It is published at the International Conference on Software Maintenance and Evolution (ICSME) 2022. In addition, I describe the new features of the Visual Debugger in the second paper, which is published at the International Conference on Software Engineering (ICSE) 2024.
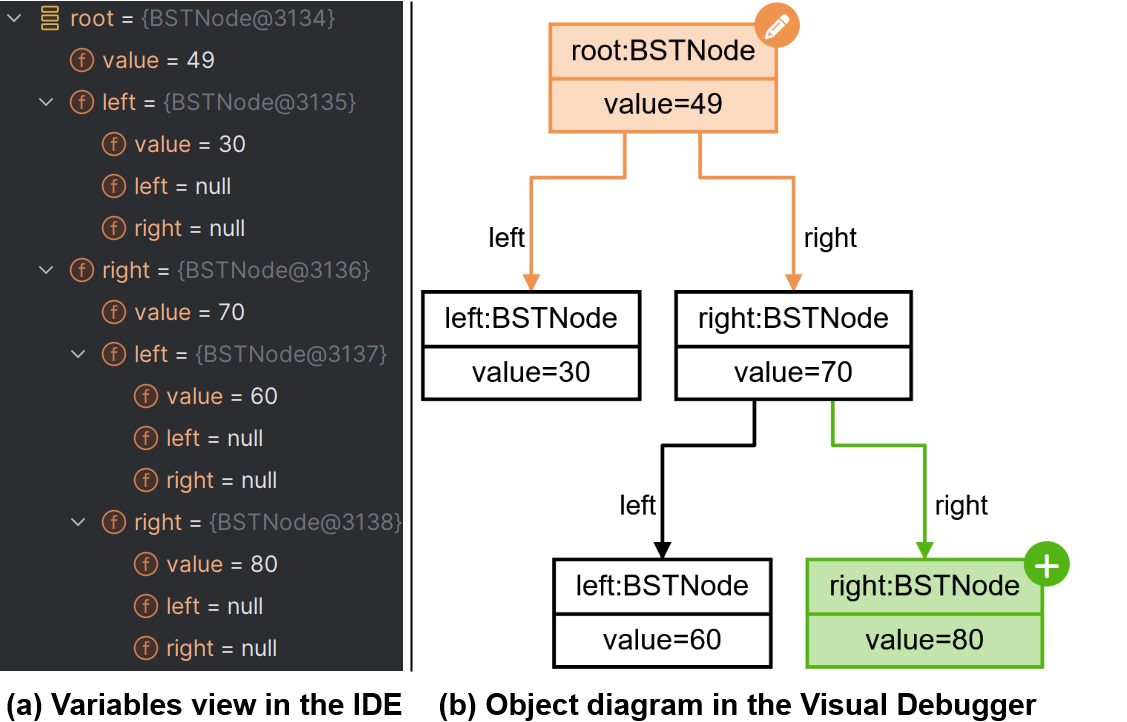
In many scenarios, graphical representations such as object diagrams are more understandable than textual representations when representing the state of an object-oriented system. You can see the different representations in the following screenshot of a binary search tree, which includes an object diagram view for the stack frame variables on the right.
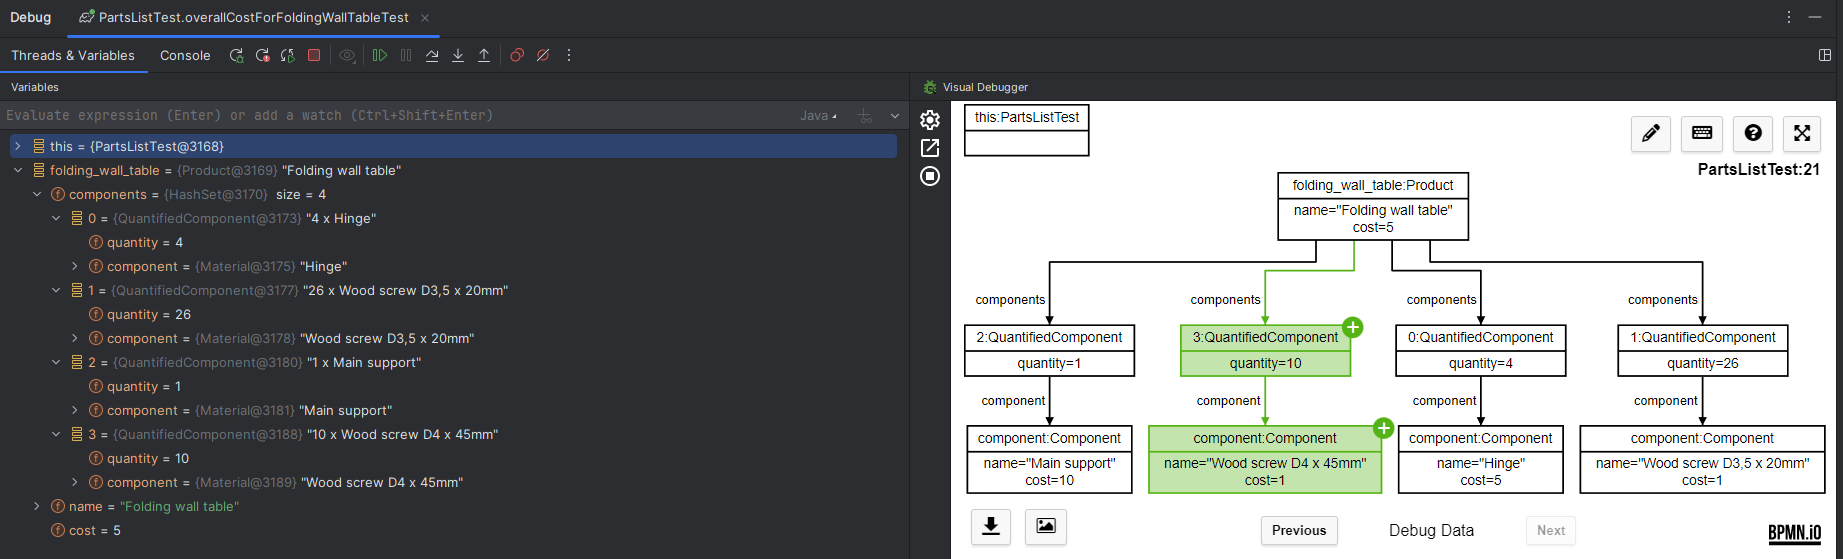
The Visual Debugger highlights changes using colors and keeps a debug history such that users can see previous object diagrams. The Visualization happens either in an external browser or integrated into the IDE using an embedded browser:
The browser will connect via WebSocket to the plugin, such that it will receive live updates when the debugger variables changed due to IDEA input. The UI is open-source and not tied to IntelliJ IDEA and can be used as a debugging view for other IDE’s and programming languages. This is possible due to the architecture of the Visual Debugger which separates obtaining stack frame variables from the visualization:

One can also export and then edit the object diagrams generated by the debugger afterward using my object diagram modeler.
For complex debugging scenarios, you can set the initial depth of visualization when using the Visual Debugger. In addition, you can export the current visualization as an SVG file.
Check the plugin out here if you are curious!